Project Goal
Providing a dashboard with at-a-glance data and metrics about the status of reported issues with users. With all the key performance metrics presented in one place, dashboard managers can more effectively measure the triple constraints of scope, solutions, and tracings timespans.
Problem / Challenge
In terms of UI/UX aspects, we predicted that we would encounter multiple and multi-layer management systems that would have an good reporting hierarchy in a private and secure area, as well as the number of issue types.
Solution
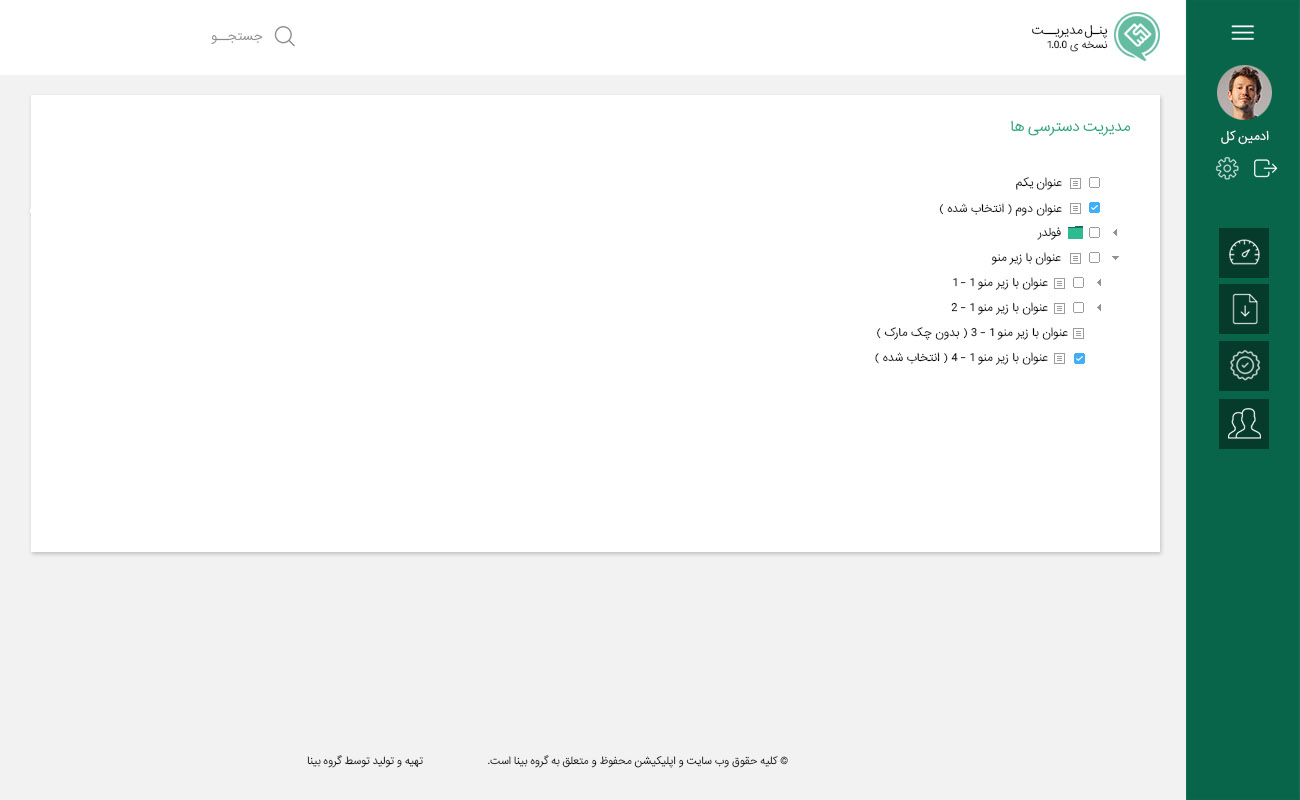
To solve our concerns, I decided to choose a tree structure for the hierarchy system and assign a dynamic color code generator for dividing and identifying the issue types.
Sign-in/Sign-up Page
UI Design for the first step of user action to login to the dashboard (The same page for both general users and Managers)
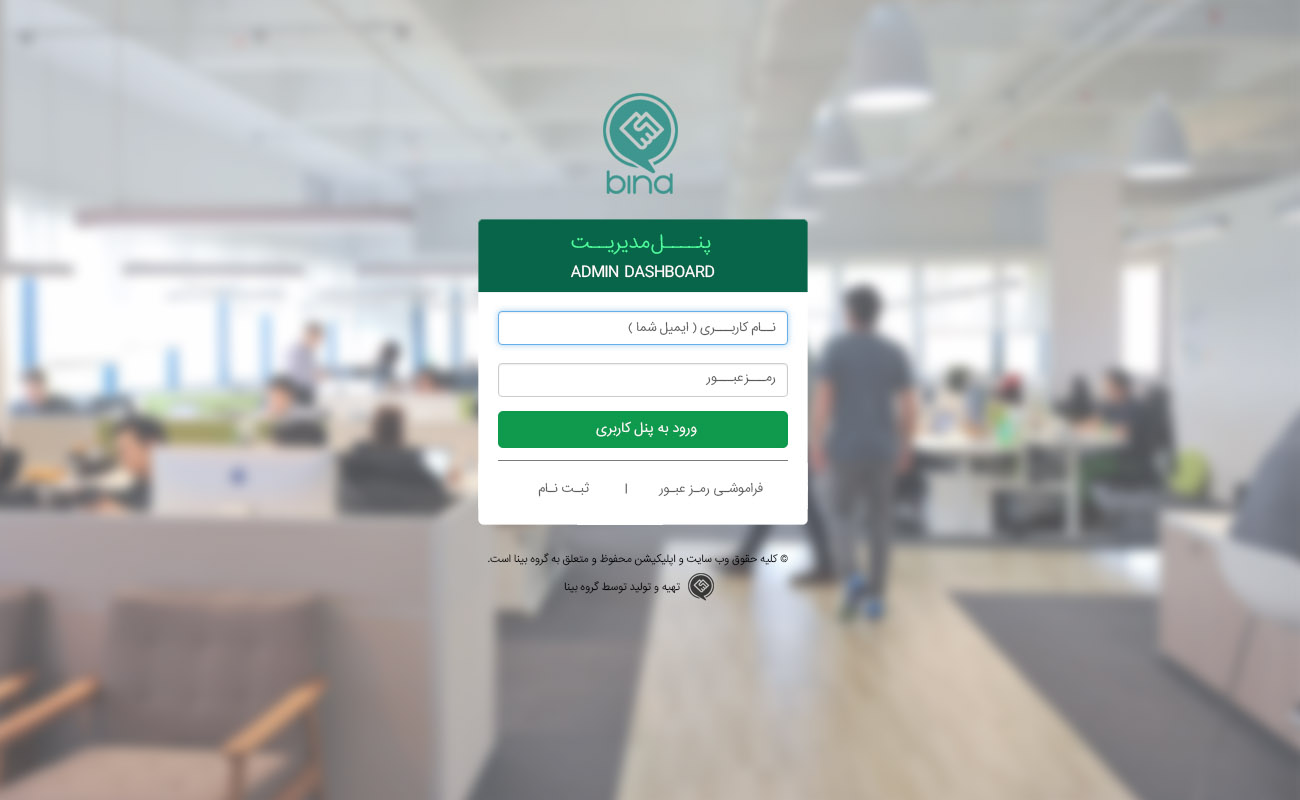
Enterance Page UI
UI/UX design for the first view of the dashboard which delivers most important data analysis with chart types
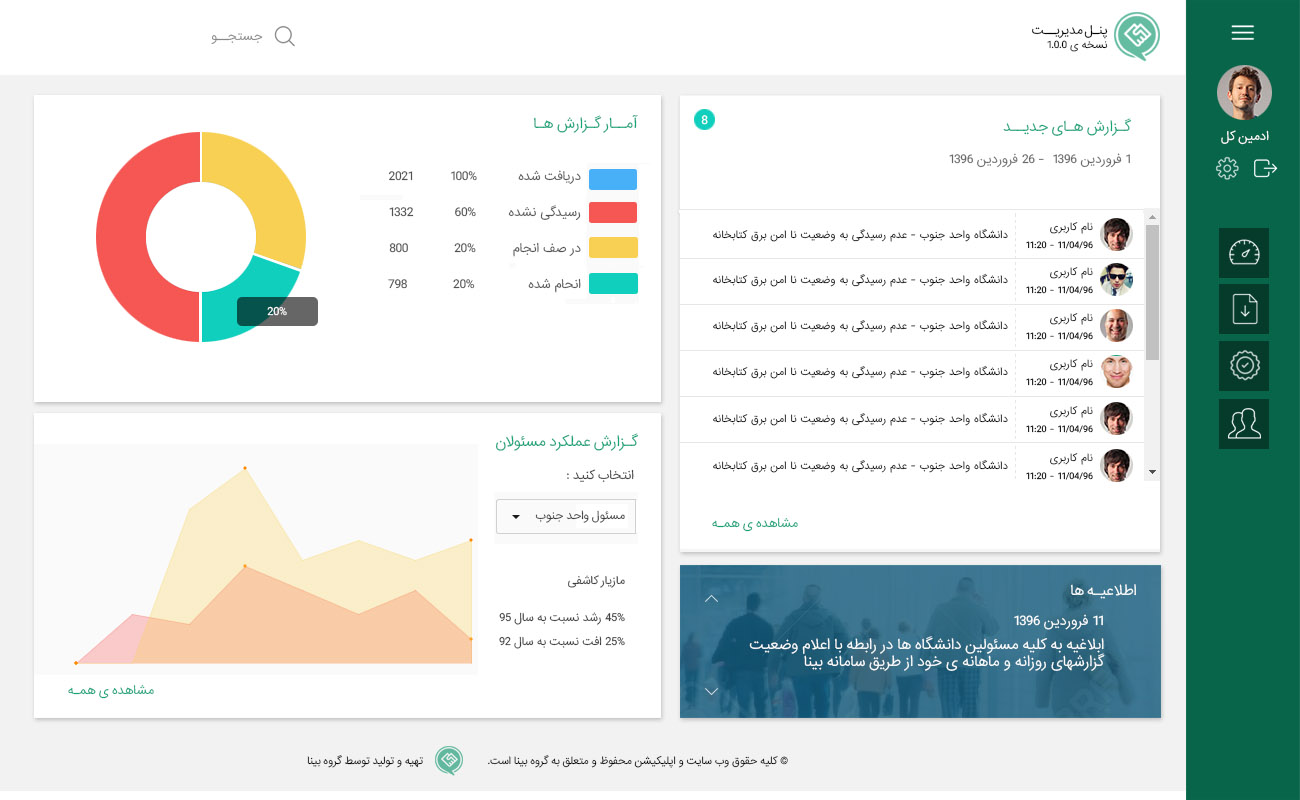
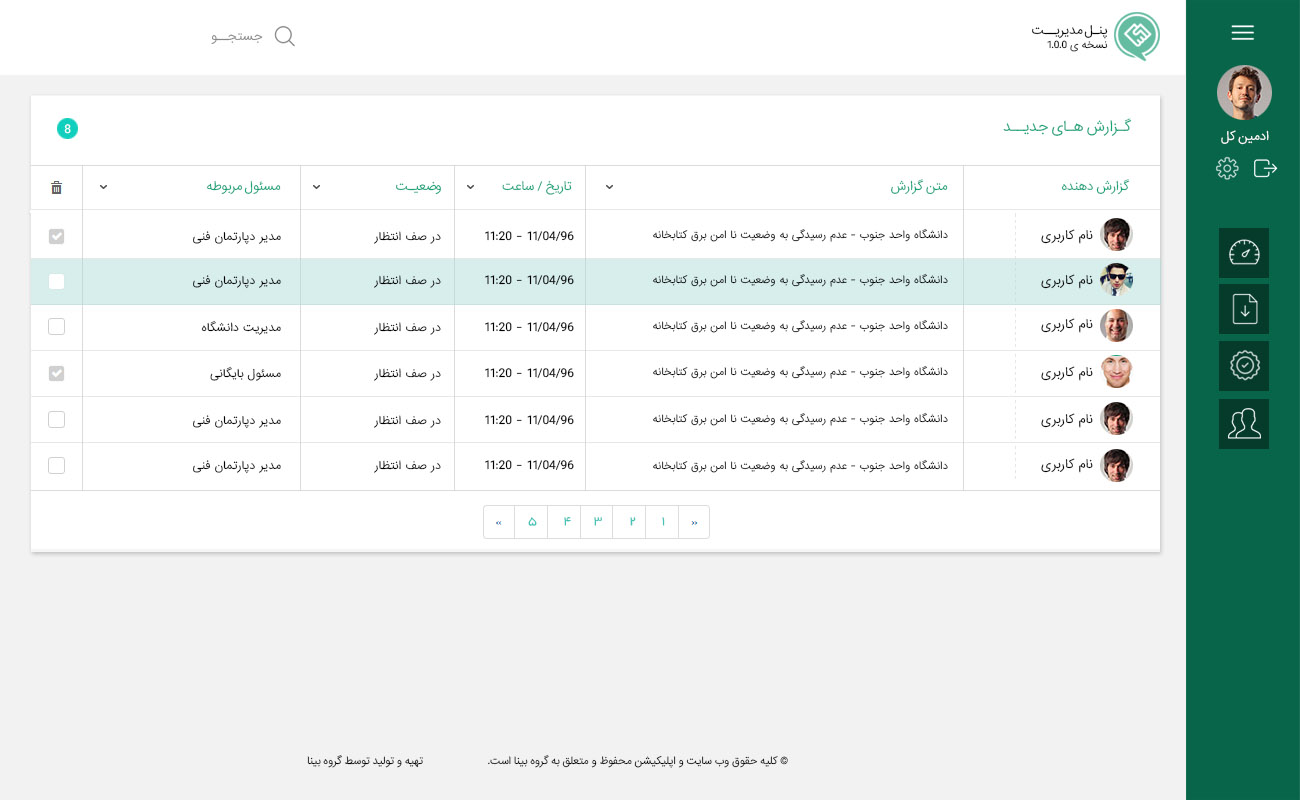
List UI
UI design for data list user interface design
Access Managements
UI/UX design for assigning manager access and privileges
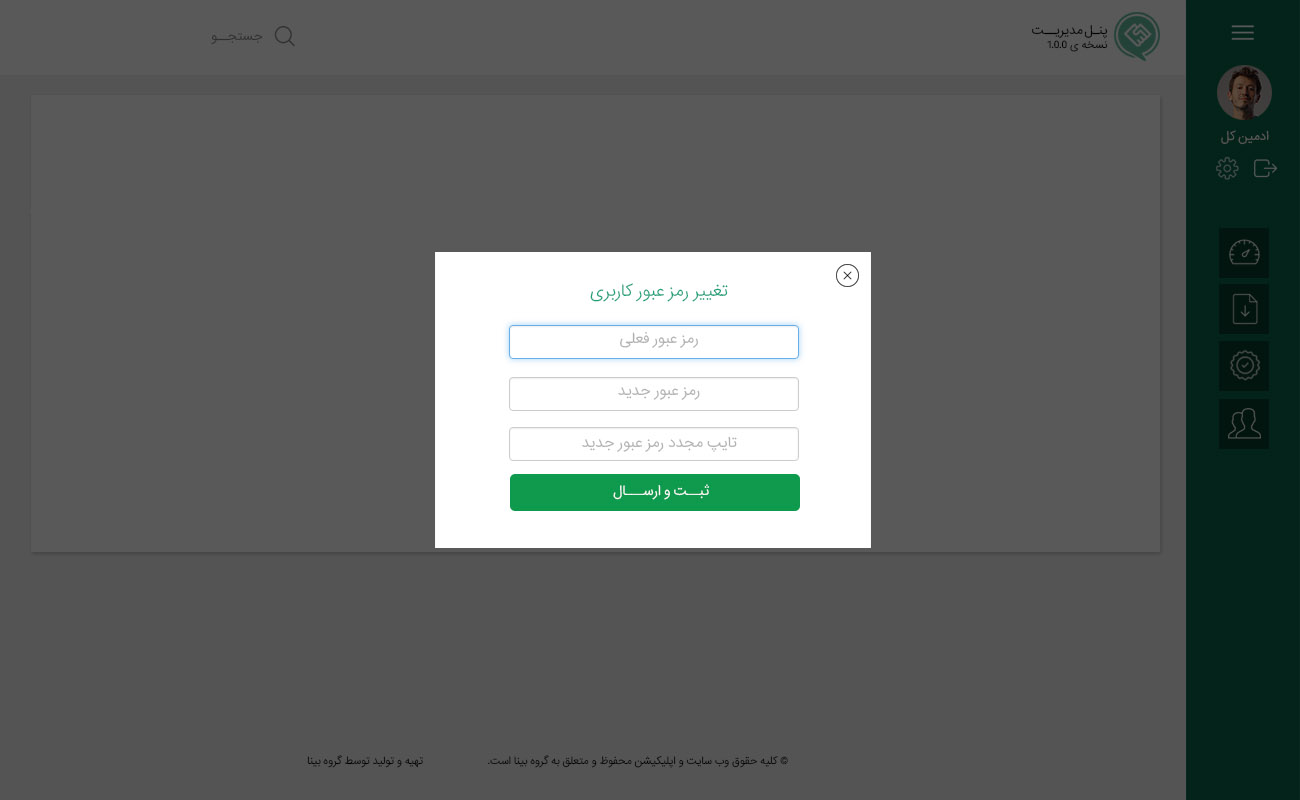
Change Password
Design for user change password
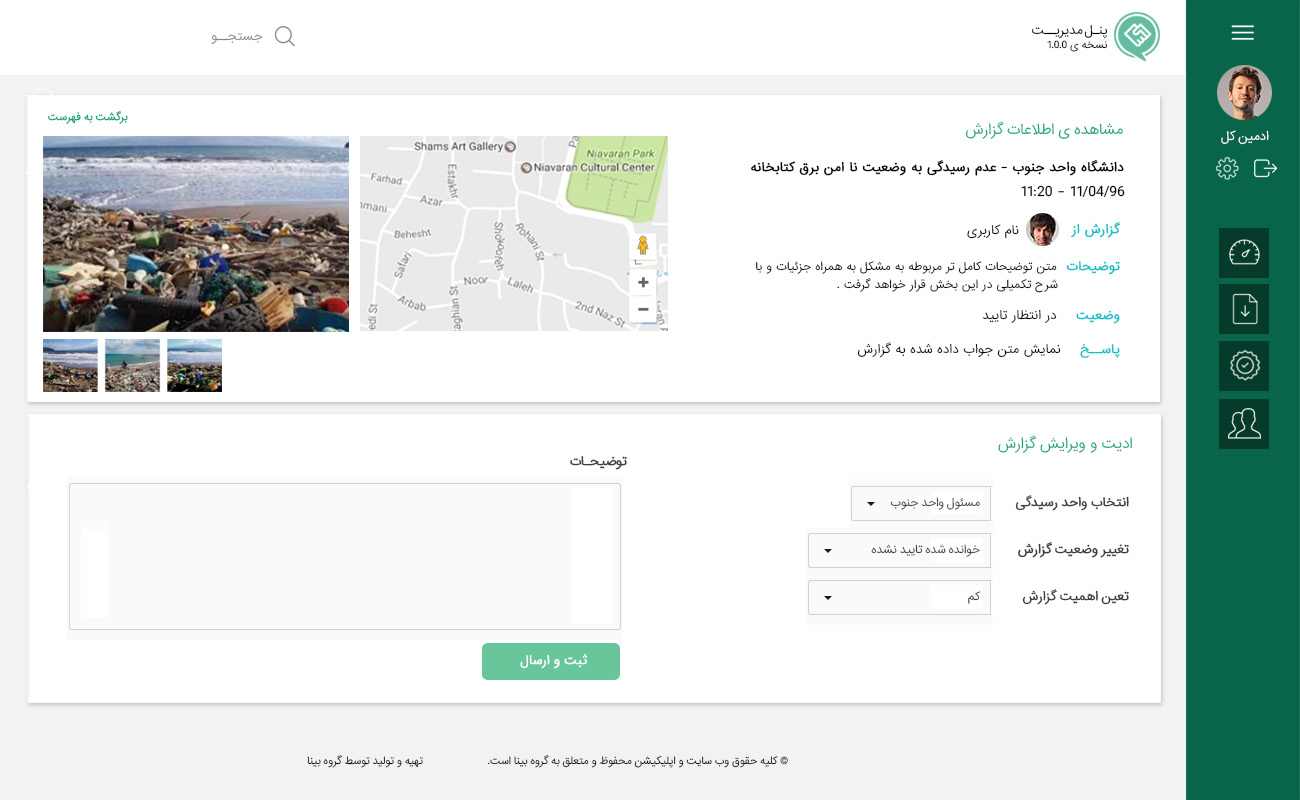
Issue Report Profile
UI/UX Design for displaying all data and inofrmation for an issue reported by users
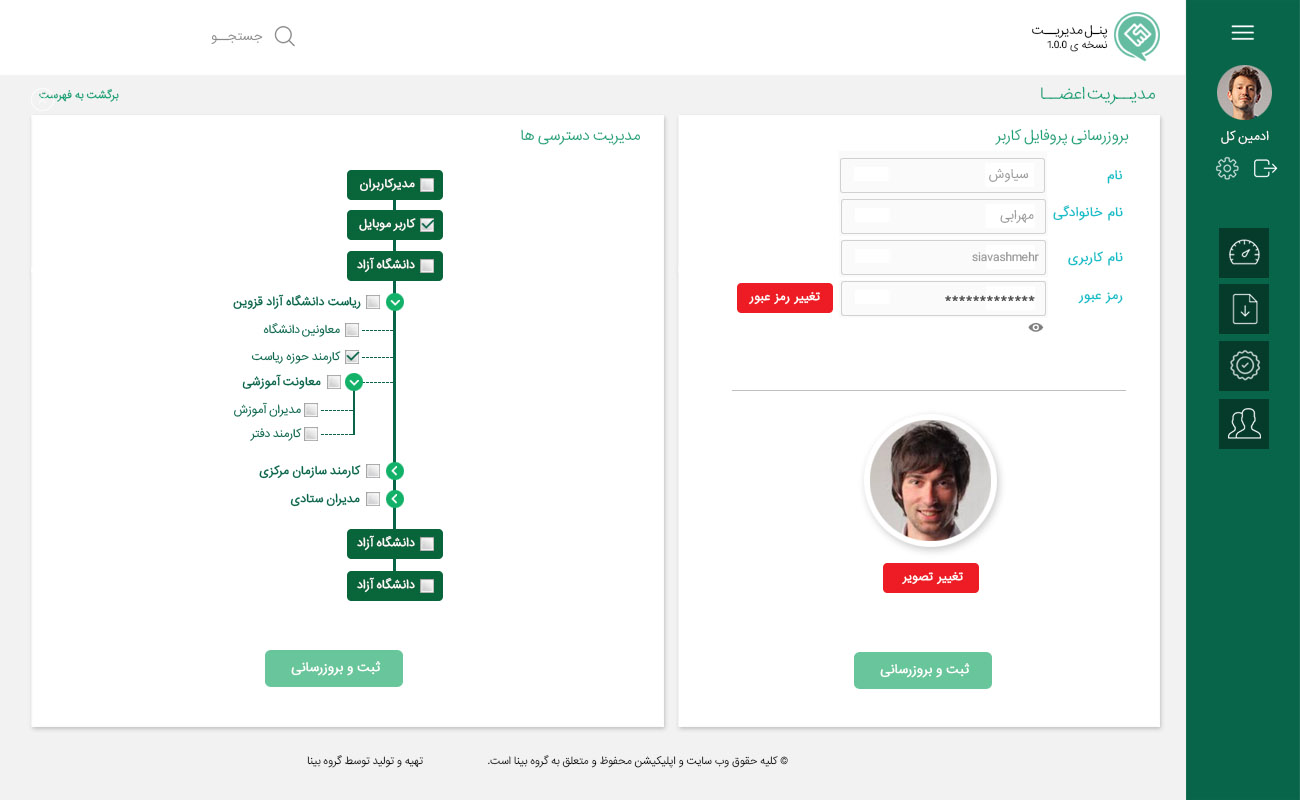
Hierarchy Management
UI/UX Design for managing and assigning management layers in an organization and their privileges
Get In Touch
I'm eagerly waiting for your contact, question, comment or quotations request.
Send Message Now